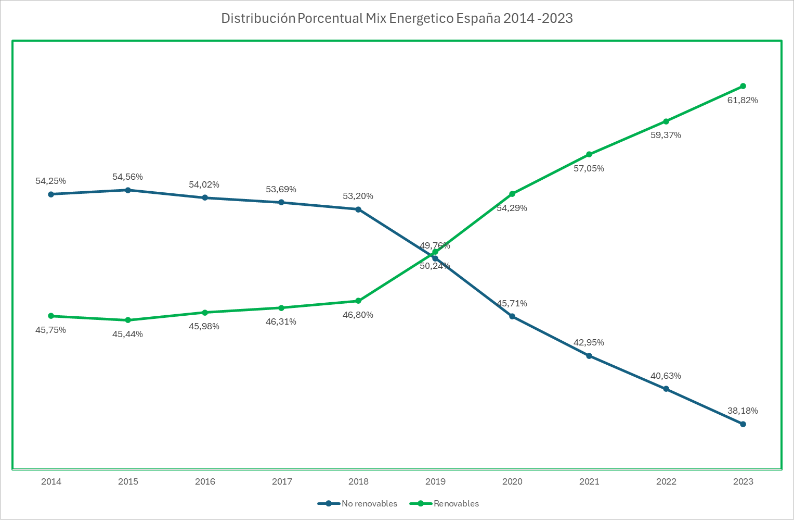
Fuente: Datos de Red Eléctrica Española (REE). Distribución porcentual del Mix Energético de España 2014-2023 / EN: Data from Red Eléctrica Española (REE). Percentage distribution of Spain’s Energy Mix 2014-2023
As seen in the graphic, year after year there has been an increase in the total installed capacity from renewable sources, meeting and exceeding Spain’s target for the percentage distribution of the country’s energy generation sources.
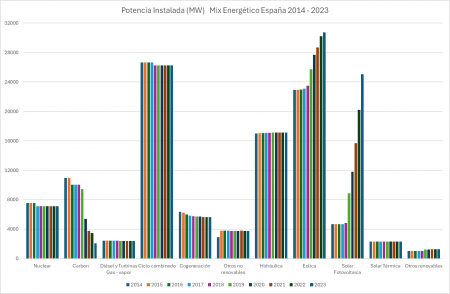
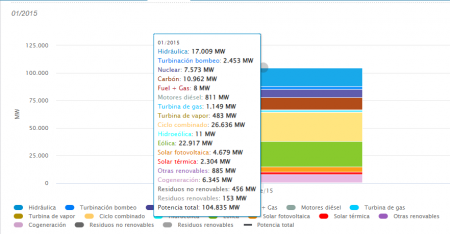
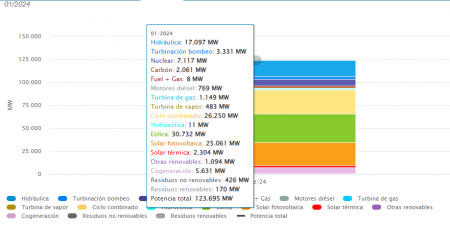
Potencia Instalada (MW). Mix Energético España 2014 – 2023. Datos de Red Eléctrica Española (REE) / EN: Installed capacity (MW). Energy Mix Spain 2014 – 2023. Data from Red Eléctrica Española (REE).
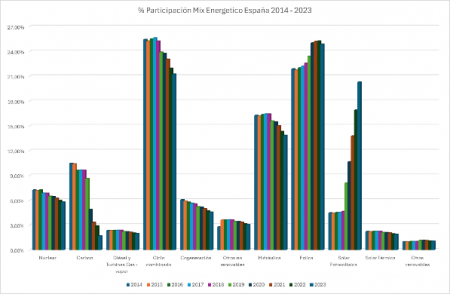
Porcentaje de Participación – Mix Energético España 2014 – 2023. Datos de Red Eléctrica Española (REE) / EN: Percentage Share – Energy Mix Spain 2014 – 2023. Data from Red Eléctrica Española (REE).
As seen in the graphs above, there has been a significant increase in the total installed capacity of both wind and solar photovoltaic power in the last 5 years.
According to the installed capacity reports on the REE website, at the beginning of 2015, solar photovoltaic energy represented 4.46% of the installed capacity in the country, and by the beginning of this year 2024 it represents 20.26% of the total installed capacity.
If we review the information on installed capacity annually from 2005 to 2026, where the installations made for self-consumption are discriminated, we can see the importance on regulatory changes have had for the growth of renewable installations at residential, commercial and industrial level, seeking not only to have clean energy sources, but additionally, an economic saving in energy costs.
Regulatory changes have been decisive elements for the growth of renewable energies.
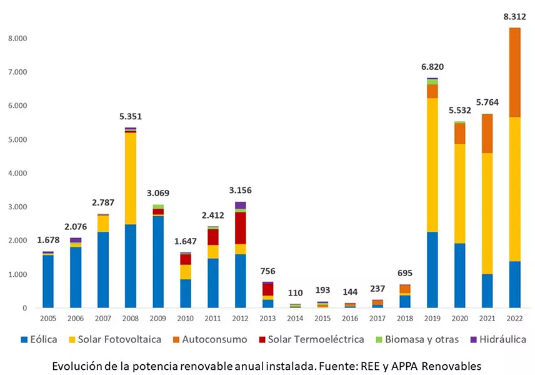
Evolución de la potencia renovable anual instalada. Fuente REE y APPA Renovables. / EN: Evolution of annual installed renewable capacity. Source: REE and APPA Renovables.
ZGR solutions for the promotion of photovoltaic solar energy in the energy mix
At ZGR we have string and modular central inverters for industrial self-consumption solutions, agrovoltaic, floating, energy communities, generation for energy sales, as well as solutions for energy storage.
We invite you to join our LinkedIn Community to stay up to date with our news and technological advances.


